Analytics
We perform systematic computational analysis of your data. We use the Analytics module to present the data in an easy to consume form.
Types of analytics
- Click on Analytics in the left sidebar to view all the consolidated analytics for all your customers.
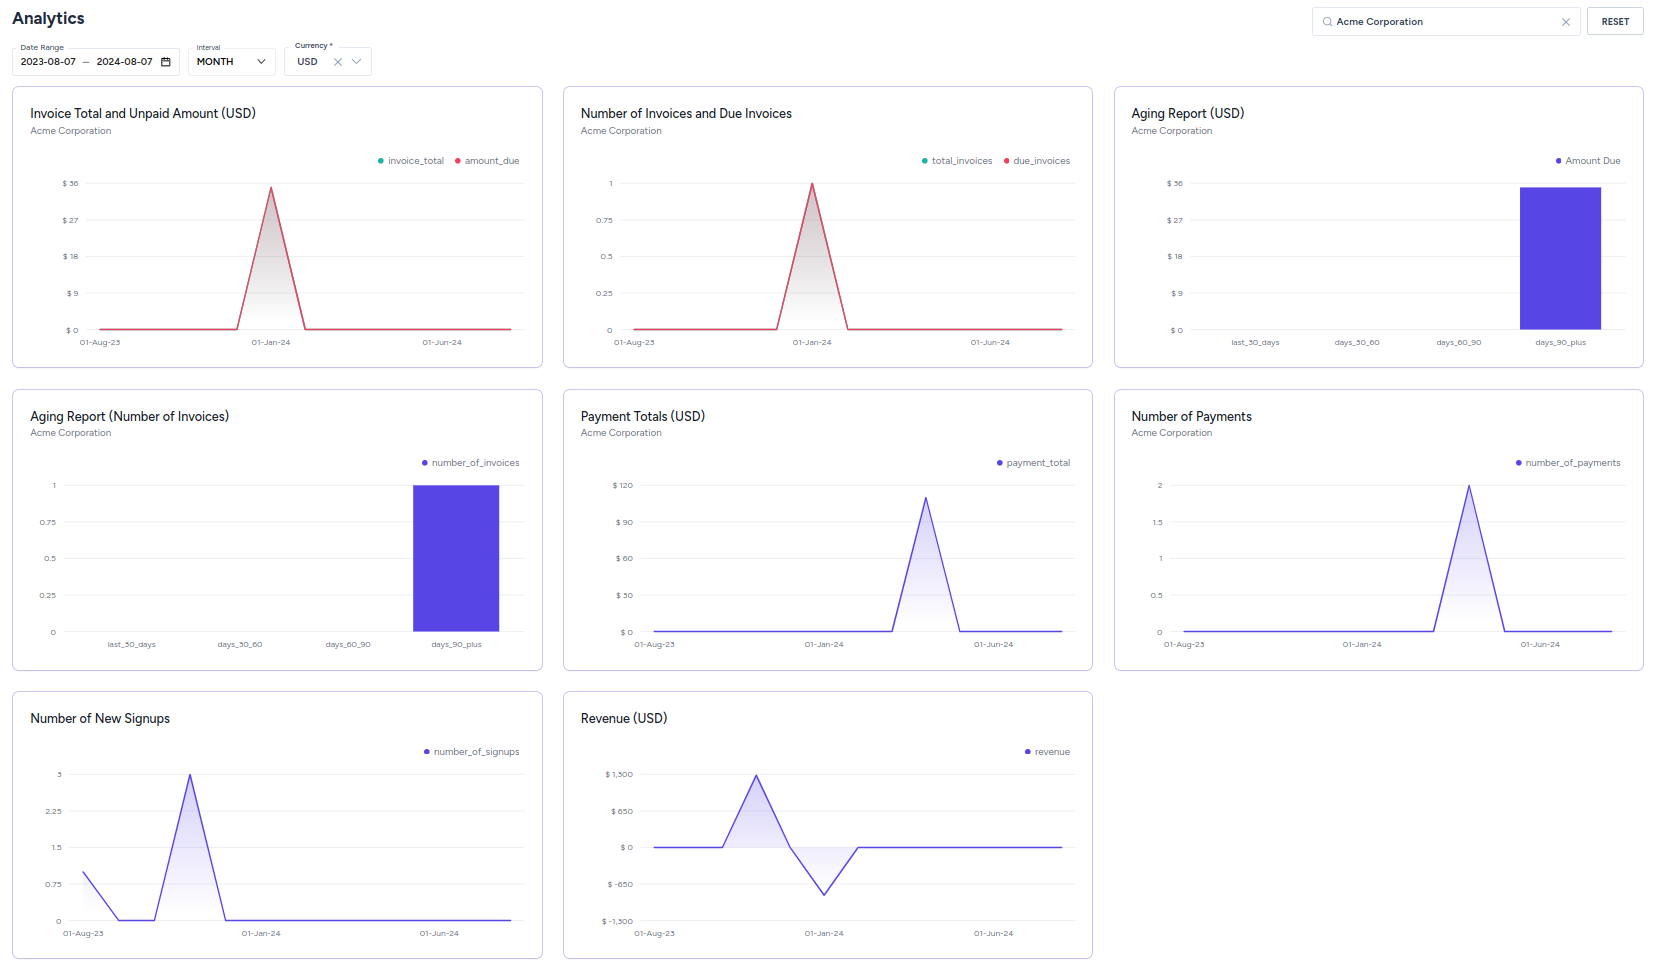
- Select the date range, interval and currency.
- Search for the customer whose analytics you are interested in.
Invoice total and unpaid amount
The invoice total and unpaid amount graph shows:
- the total amount of all approved invoices
- the total unpaid amount
These analytics are derived from the data from the Invoices module.
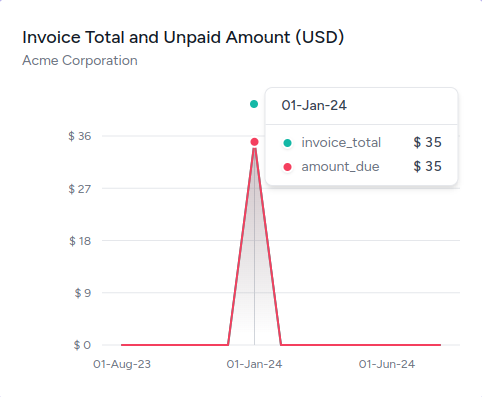
For example, the above graph is for your fictional customer Acme Corporation who has:
- a total of $35 in approved invoices
- a total of $35 in dues

Number of invoices and due invoices
This graph shows:
- the total number of approved invoices
- the total number of unpaid invoices
These analytics are derived from the data from the Invoices module.
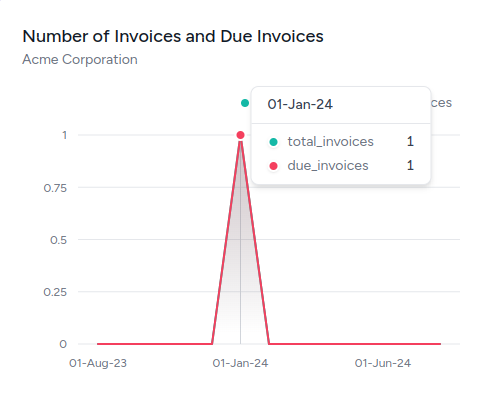
For example, the above graph is for your fictional customer Acme Corporation who has:
- one approved invoice
- one unpaid invoice
Aging report
This graph shows the total amount in approved invoices approved in the past:
- 30 days
- 30 to 60 days
- 60 to 90 days
- 90 or more days
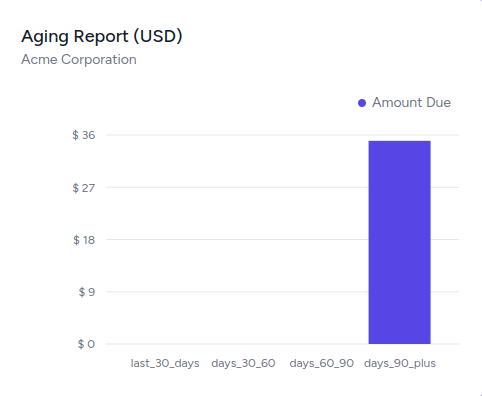
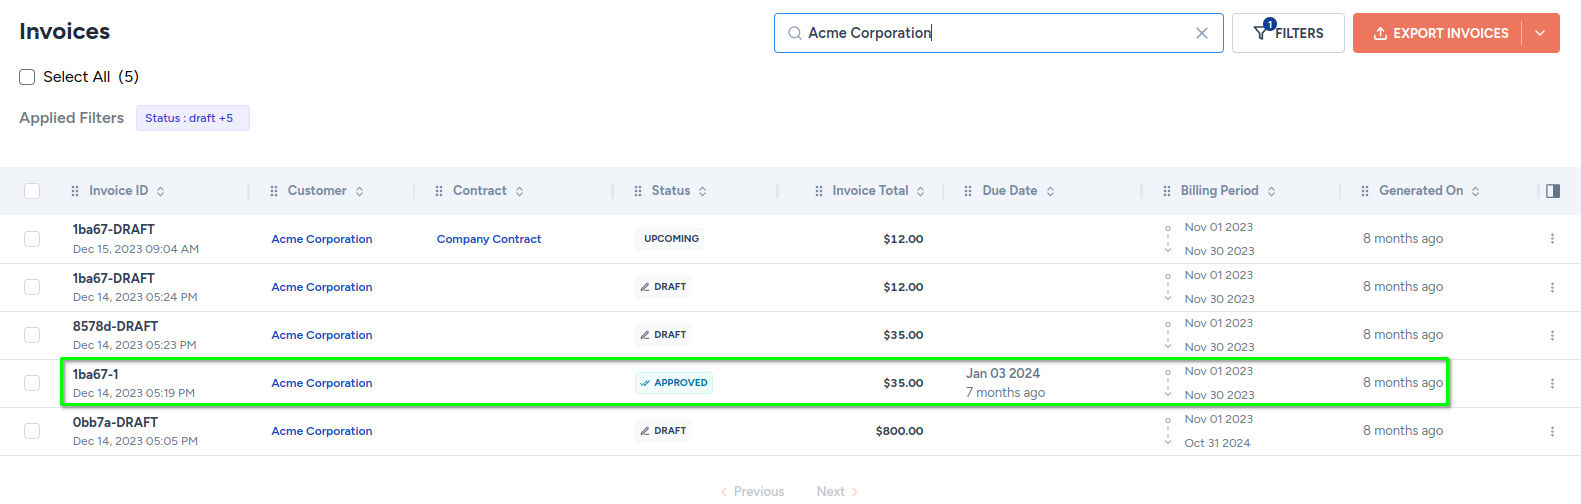
Clicking on the bar of the graph takes you to the Invoices page with proper filters already applied.
Aging report for invoices
This graph shows the total number of approved invoices approved in the past:
- 30 days
- 30 to 60 days
- 60 to 90 days
- 90 or more days
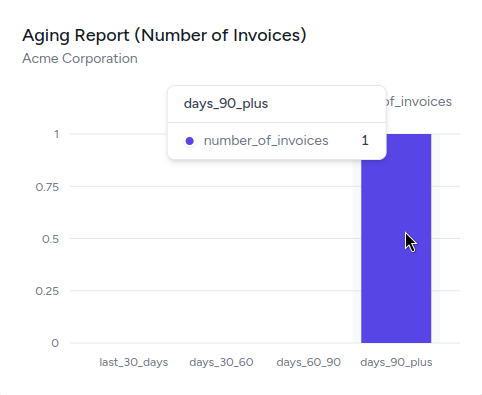
These analytics are derived from the data from the Invoices module.
Payment totals
This graph shows the total payments received from your fictional customer Acme Corporation in the date range selected.
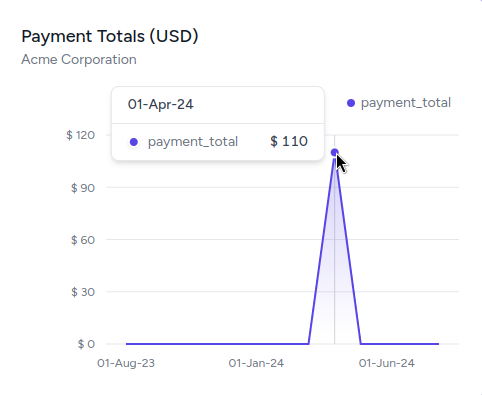
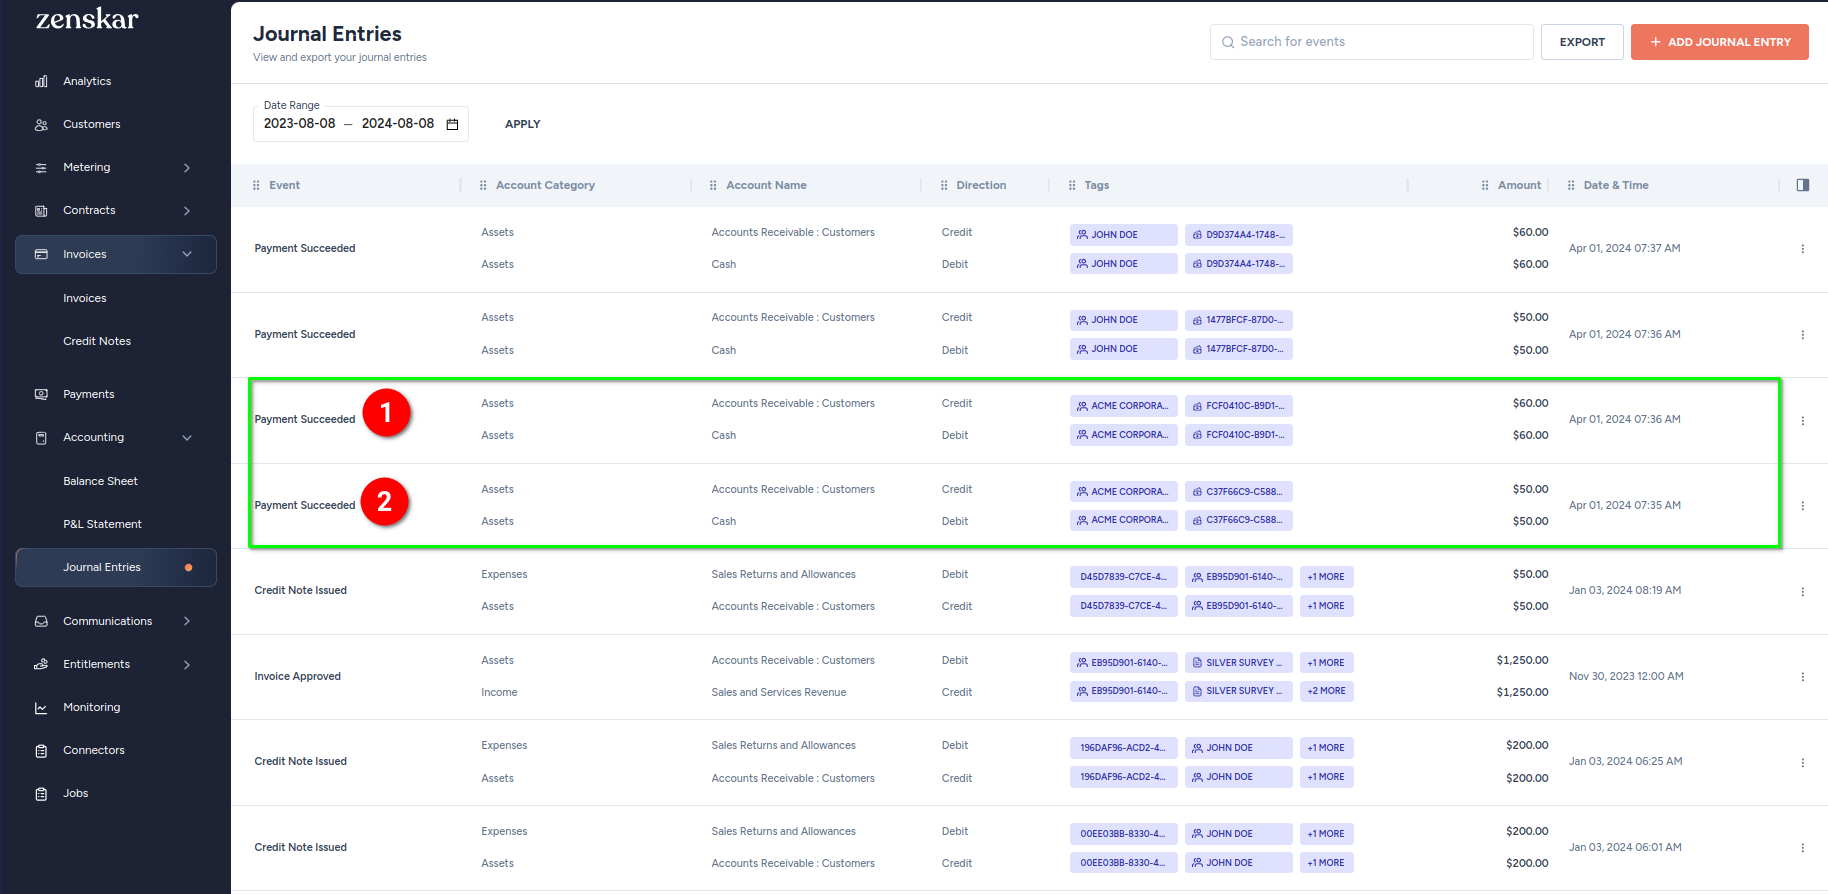
This graph derives data from the Journal Entries in the Accounting module.
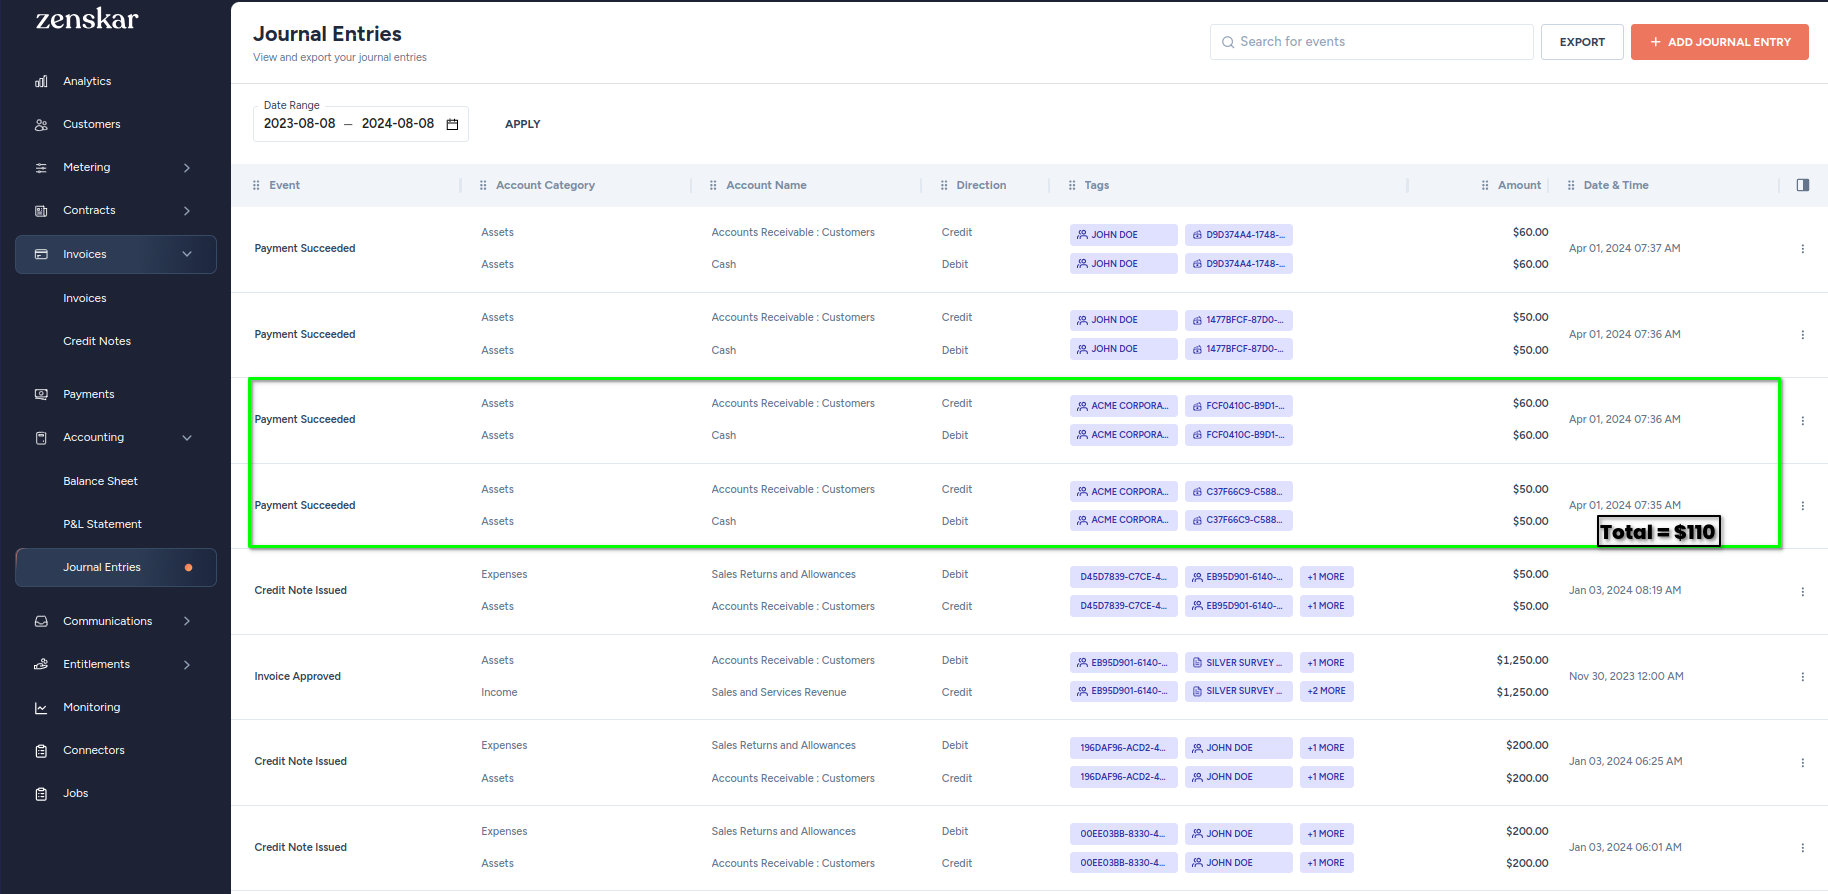
Number of payments
This graph shows the number of payments received from your fictional customer Acme Corporation in the date range selected.

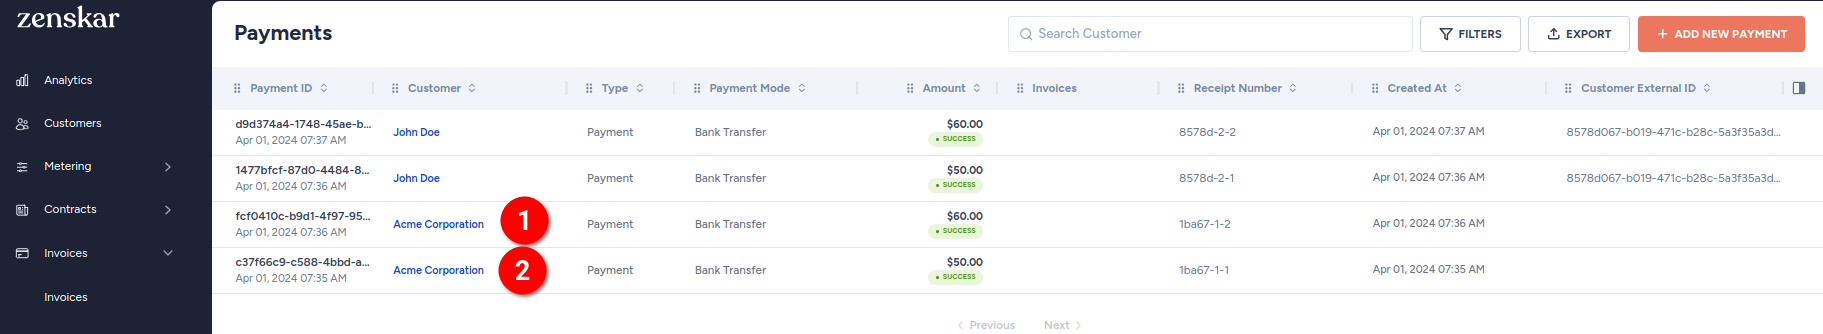
This graph data can be verified in Journal Entries in the Accounting module.
This graph data can also be verified in the Payments module.
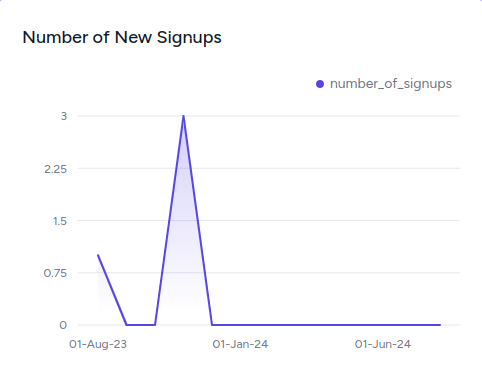
Number of new signups
This graph shows the number of new customers added to Zenskar in the date range selected.
Note
The customer filter has no effect on this graph.
Revenue
This graph shows the total revenue from all your customers in the date range selected.
Note
The customer filter has no effect on this graph. This graph shows consolidate revenue from all your customers.
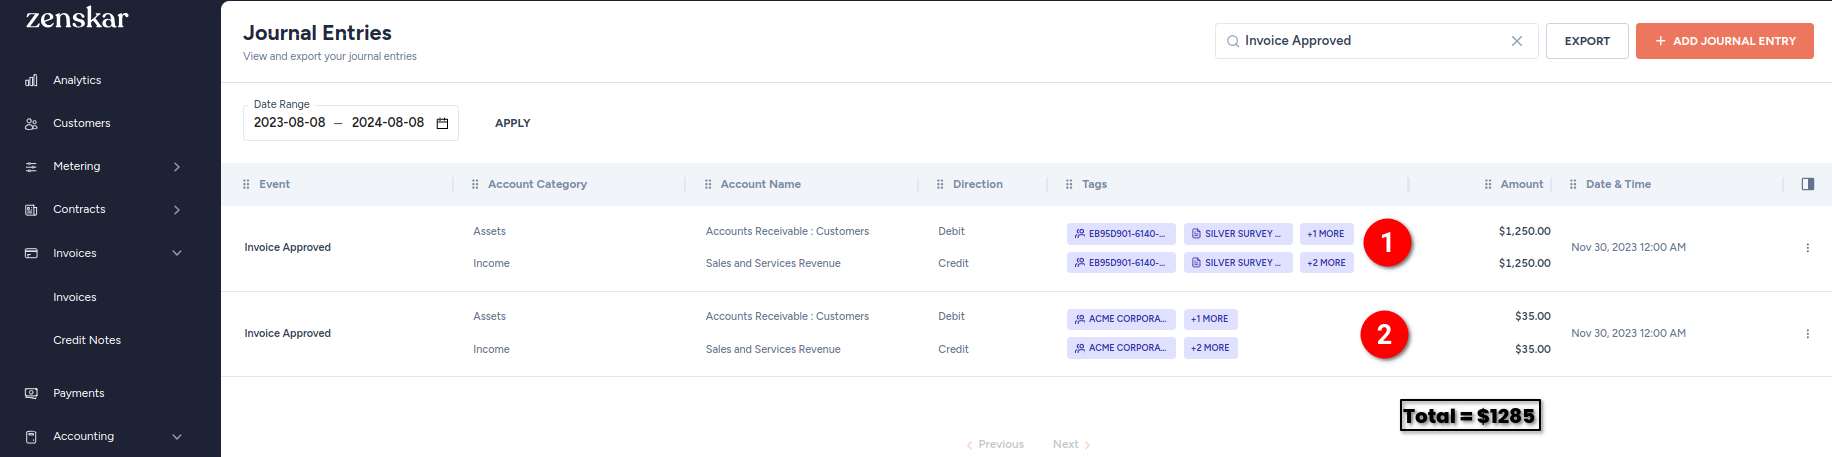
These analytics are derived from Journal Entries in the Accounting module, as shown below.
The total estimated inflow of revenue due to approved invoices ($1285):
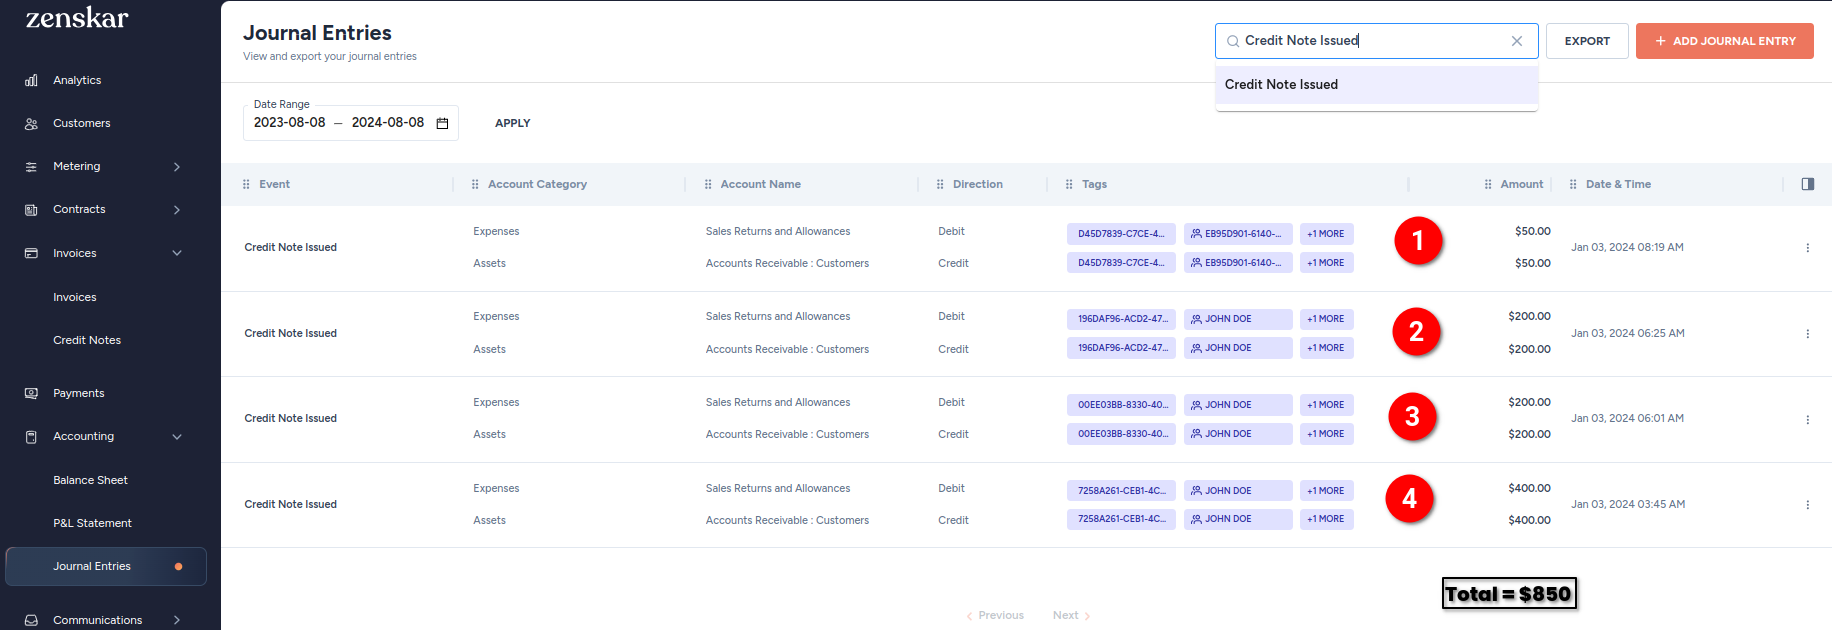
The total outflow of revenue due to credit notes ($850):
Updated about 2 months ago