Monitoring
You can monitor various aspects of your customer's contract and usage.
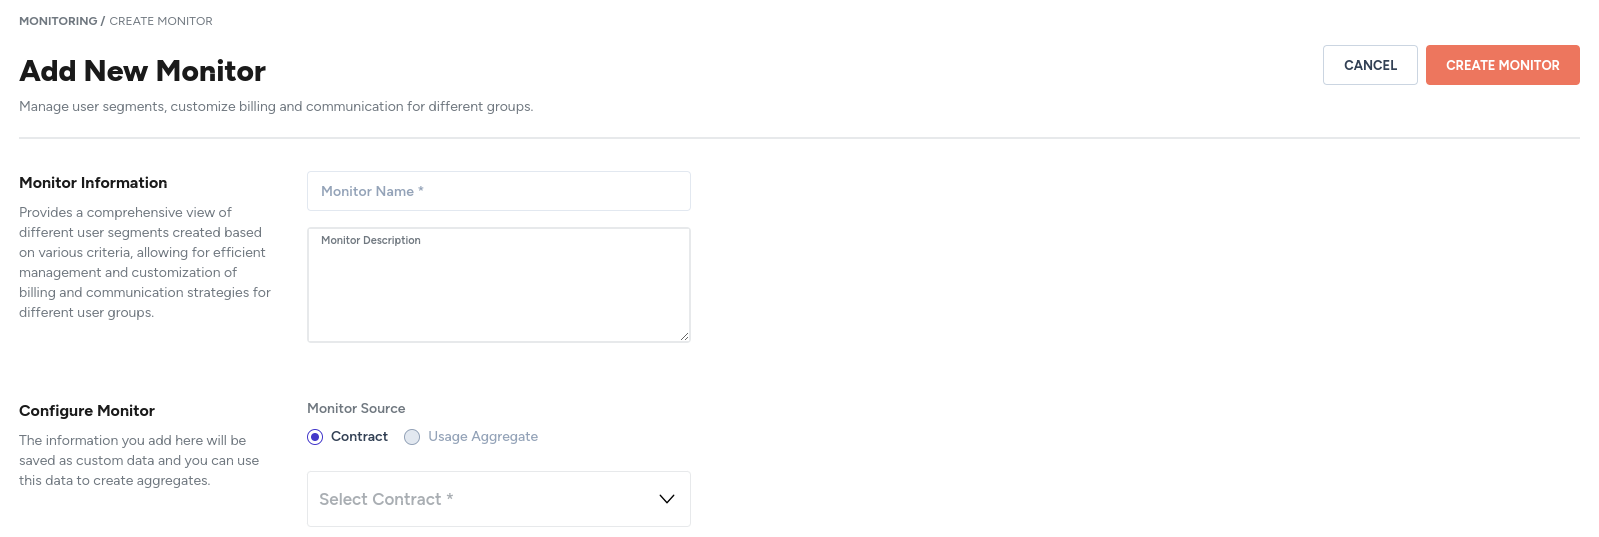
Add a monitor
- Click on Monitoring in the left sidebar.
- Click on the ADD MONITOR button.
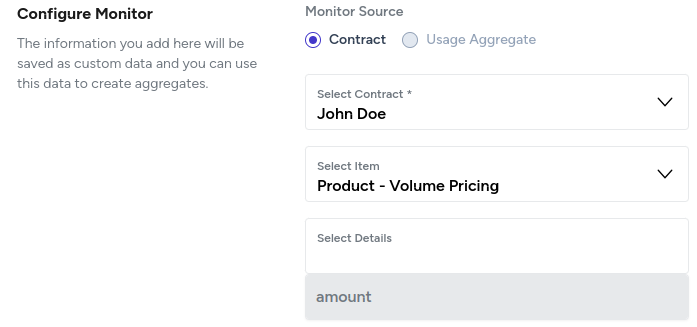
- Fill in the following details:
- Monitor name: a descriptive name for the monitor.
- Monitor description: add a description for the monitor.
- Monitor source: choose from Contract and Usage Aggregate.
Select contract
- Click on the Select Contract dropdown.
- Select the contract you would like to add monitors for.
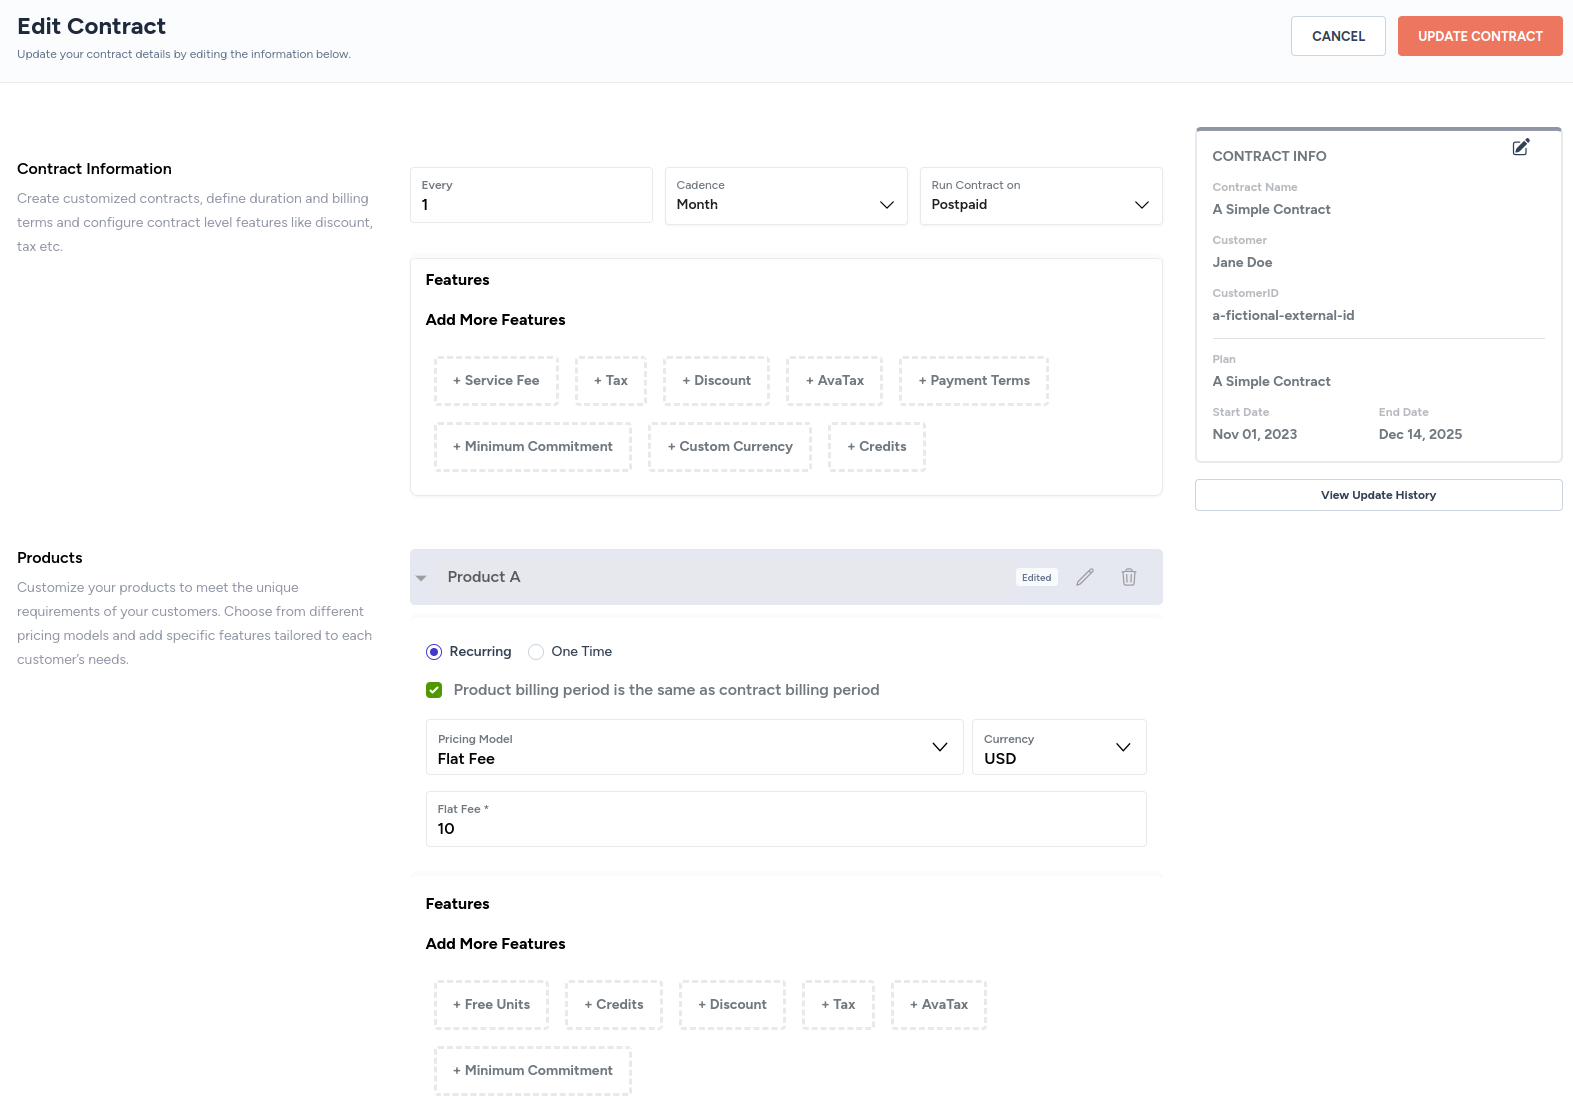
The example contract, A Simple Contract, has only one flat-fee based product.
- Click on the newly added Select Item dropdown.
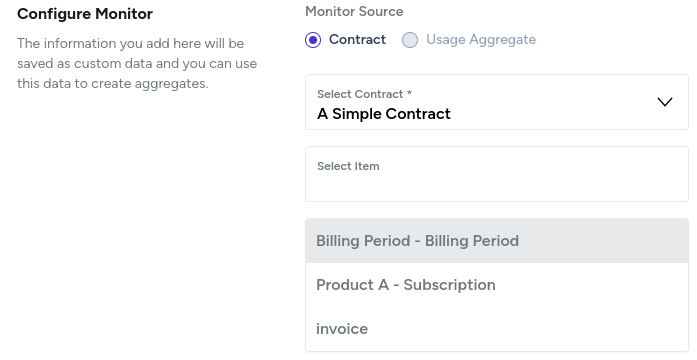
- Select itmes:
- You can add monitors for various aspects of the billing period, such as:
end_date: end date of the billing period.start_date: start date of the billing period.cycle_length: how many days/weeks/months/years does a billing cycle last.cycle_unit: unit of the cycle (day/week/month/year).cycle_start_date: start date of the billing cycle.contract_start_date: start date of the contract.
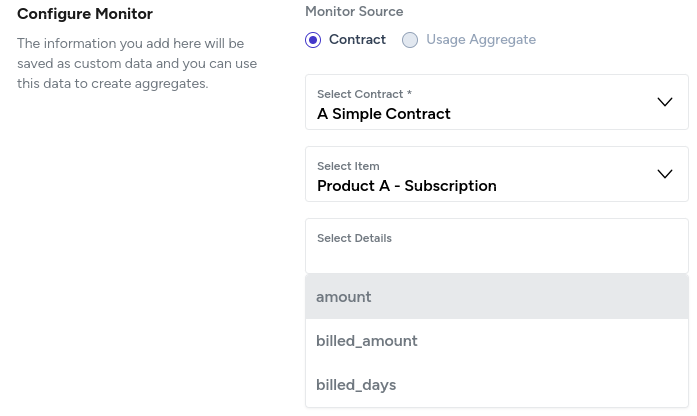
- You can add monitors for various aspects of a product. The aspects are dependent on the product.
- For example, for a flat-fee-based product,
amount,billed_amount, andbilled_dayscan be selected. - For example, for a volume-pricing-based product, only
amountcan be monitored.
- For example, for a flat-fee-based product,
- You can add a monitor for invoice by selecting
invoice_total.
Select usage aggregate
Coming soon
View a monitor
- Click on Monitoring in the left sidebar.
- All available monitors will be listed on the Monitoring page.
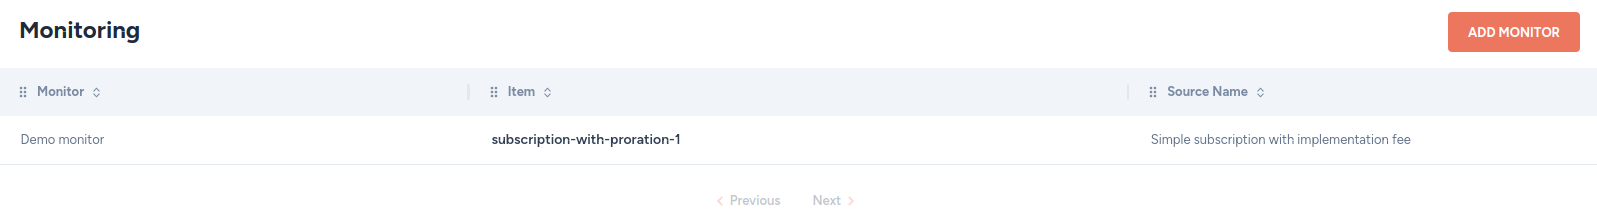
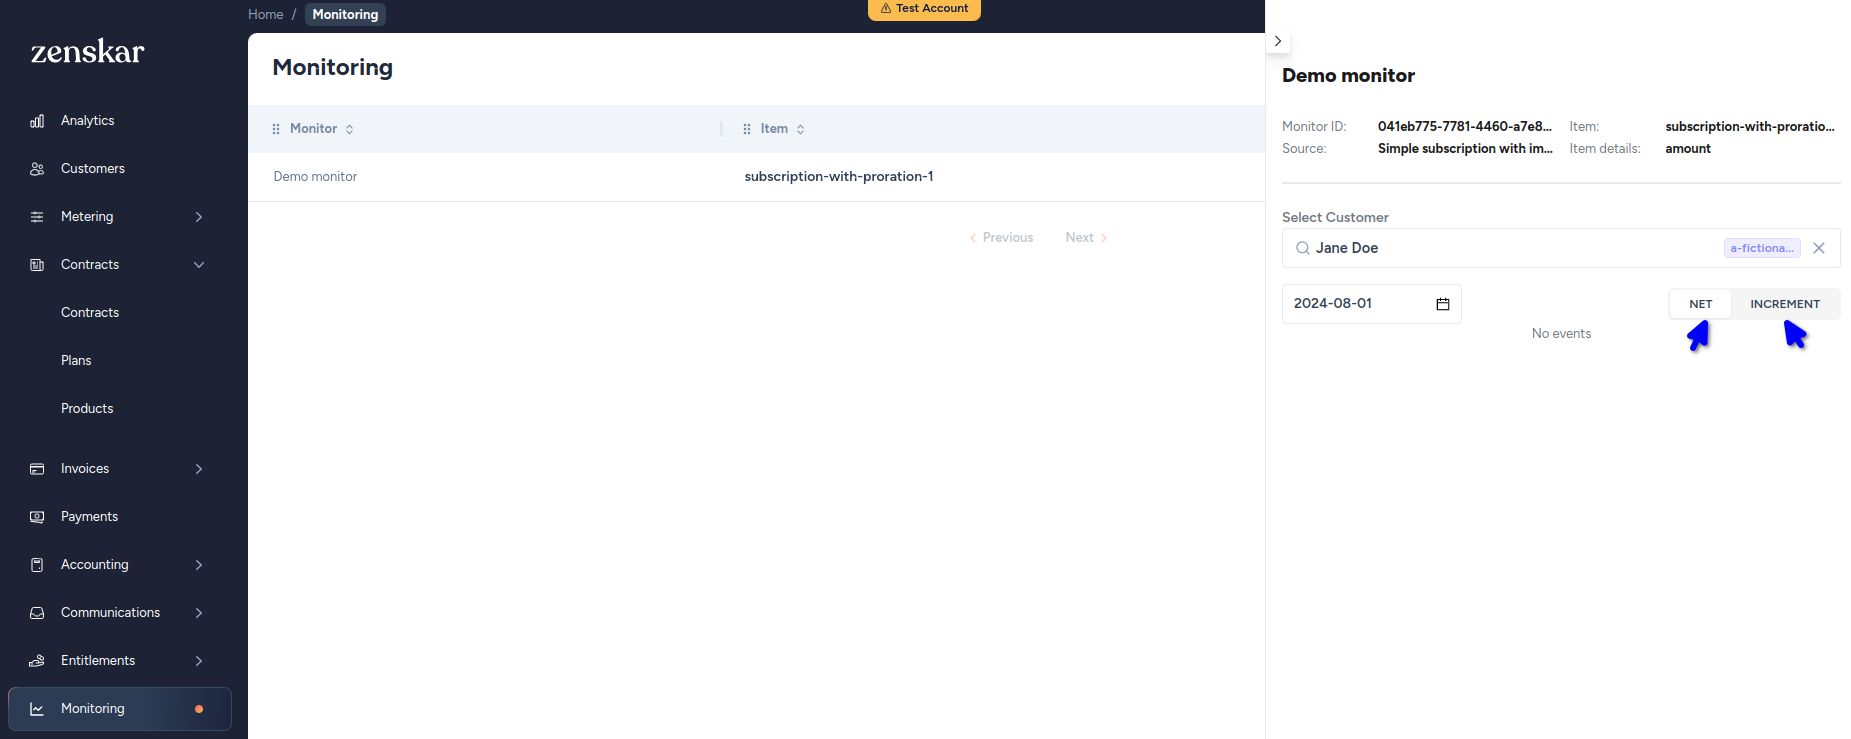
- Click on the monitor you are interested in.
- A panel will appear on the right side. Select the following parameters to view the monitor:
- Customer: select the customer.
- Select date: select the date for which you want to view the monitor.
- Net or increment: The net value of the monitor or the increment compared to the previous day.
Updated 5 months ago
What’s Next
Checkout the API Docs section for our client facing APIs for integrating it in your Product/Analytics Dashboards.
Did this page help you?