Monthly recurring revenue by product
Definition
Monthly recurring revenue (MRR) is the portion of your revenue that recurs on a monthly basis from active subscriptions. For example, an annual plan worth $1,200 contributes $100/month to MRR. MRR excludes one-time charges and credits.
Visualizations
Net MRR by products chart

Description
This chart visualizes how your monthly recurring revenue (MRR) is distributed across individual products over time. It helps you understand which products contribute most to your recurring revenue and how their performance changes month-over-month.
Chart components
- X-axis: Months (e.g., Jan 2024 to May 2025).
- Y-axis: Net MRR in USD for each month.
- Bars: Each bar represents the total net MRR for that month, broken down by product.
- Legend: The legend at the top maps colors to products.
Interpretation & insights
- Top revenue-generating products: Products with larger segments in the bar contribute more to MRR.
- Product performance trends: You can track how the revenue from a particular product is growing, shrinking, or staying constant.
- Revenue diversification: Visualize how many different products make up your MRR, and whether you're relying heavily on one.
- Example insights:
- Loan Subscription is the dominant contributor to MRR across all months.
- There’s a significant increase in total MRR in Jan 2025, possibly due to new product additions or expansion.
- Some minor contributors like [AI] Tokens and Short Subscription appear consistently but at lower levels.
Expansion of MRR by products chart
Description
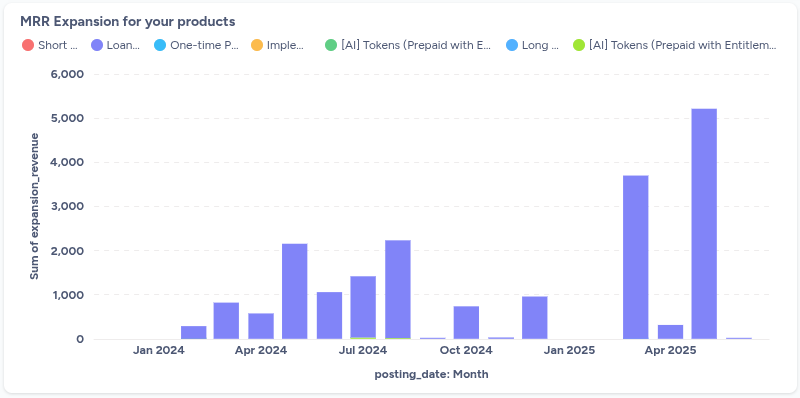
This chart shows positive changes in MRR — i.e., revenue growth — attributed to existing customers upgrading, increasing usage, or purchasing add-ons.
Chart components
- X-axis: Time (monthly intervals).
- Y-axis: Amount of expansion revenue in USD.
- Bars: Each bar shows total expansion revenue for a month, broken down by product (color-coded).
- Legend: The legend at the top maps colors to products.
Interpretation & insights
- Which products are driving expansion revenue.
- When expansion activities peaked (e.g., Apr 2025 shows a sharp rise in expansion).
- Helps identify successful upsell campaigns or increased customer adoption.
Contraction of your MRR by products
Description
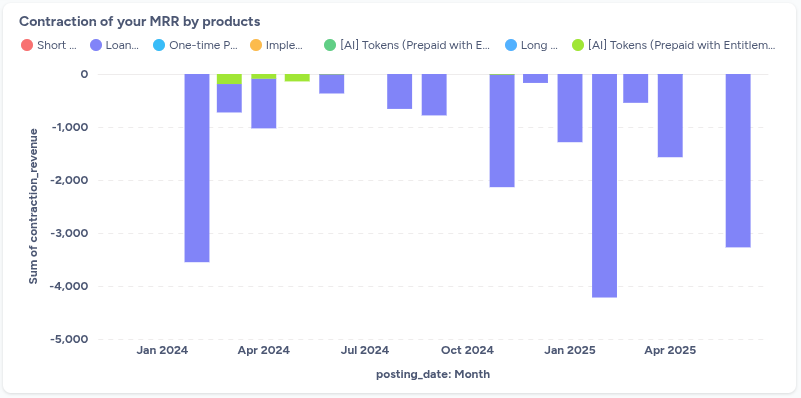
This chart captures negative changes in MRR — i.e., revenue shrinkage — due to downgrades, reduced usage, or removal of product entitlements.
Chart components
- X-axis: Time (monthly intervals).
- Y-axis: Amount of contraction revenue in USD (shown as negative values).
- Bars: Each bar shows total contraction revenue for a month, segmented by product (color-coded).
- Legend: The legend at the top maps colors to products.
Interpretation & insights
- Which products experienced downgrades or reduced usage.
- Months with significant MRR loss (e.g., Jan 2024 and Jan 2025 show large contractions).
- Can help diagnose churn risk and retention challenges for specific products.
Importance
These two charts help you understand net revenue movement:
- High expansion and low contraction = healthy revenue growth.
- High contraction and low expansion = red flag that may need immediate attention.
- These insights complement the net MRR by products chart by revealing the underlying movements in recurring revenue.
Updated 5 months ago