Monthly recurring revenue
Definition
Monthly recurring revenue (MRR) is the predictable revenue a business can expect each month from active subscriptions. MRR provides a standardized view of recurring revenue performance by normalizing all subscription revenue to a monthly basis, regardless of actual billing frequency.
Key characteristics:
- Predictable: Based on committed subscription revenue
- Recurring: Excludes one-time charges and credits
- Normalized: Annual contracts contribute 1/12th monthly, quarterly contracts contribute 1/3rd monthly
Formula
Net MRR = Starting MRR + New MRR + Expansion MRR - Contraction MRR - Churn MRR
Component definitions
| Component | Definition | Examples |
|---|---|---|
| Starting MRR | Recurring revenue carried forward from previous month | Existing subscription base |
| New MRR | Revenue from new customer subscriptions | First-time customers, new product adoptions |
| Expansion MRR | Additional revenue from existing customers | Plan upgrades, add-ons, increased usage |
| Contraction MRR | Revenue lost from existing customers | Plan downgrades, seat reductions |
| Churn MRR | Revenue lost from canceled subscriptions | Complete account cancellations |
Business importance
MRR serves as the foundation for SaaS business management:
Growth tracking: Provides month-over-month growth visibility without seasonal billing variations
Revenue predictability: Enables accurate short-term revenue forecasting
Performance analysis: Isolates growth drivers (new vs. expansion vs. retention)
Investor relations: Standard metric for SaaS valuations and reporting
Operational decisions: Guides sales, marketing, and customer success resource allocation
Benchmarks by company stage:
- Early stage: 15-20% monthly MRR growth
- Growth stage: 10-15% monthly MRR growth
- Mature stage: 5-10% monthly MRR growth
Data calculation in Zenskar
Zenskar computes MRR automatically based on:
- Contract terms: Subscription pricing and billing frequency
- Customer status: Active subscription states
- Usage patterns: Variable usage charges normalized to monthly averages
- Billing events: Upgrades, downgrades, and cancellations
Normalization logic:
- Annual contracts: Contract value ÷ 12
- Quarterly contracts: Contract value ÷ 3
- Usage-based: Rolling 3-month average × monthly factor
Visualization components
MRR breakdown chart
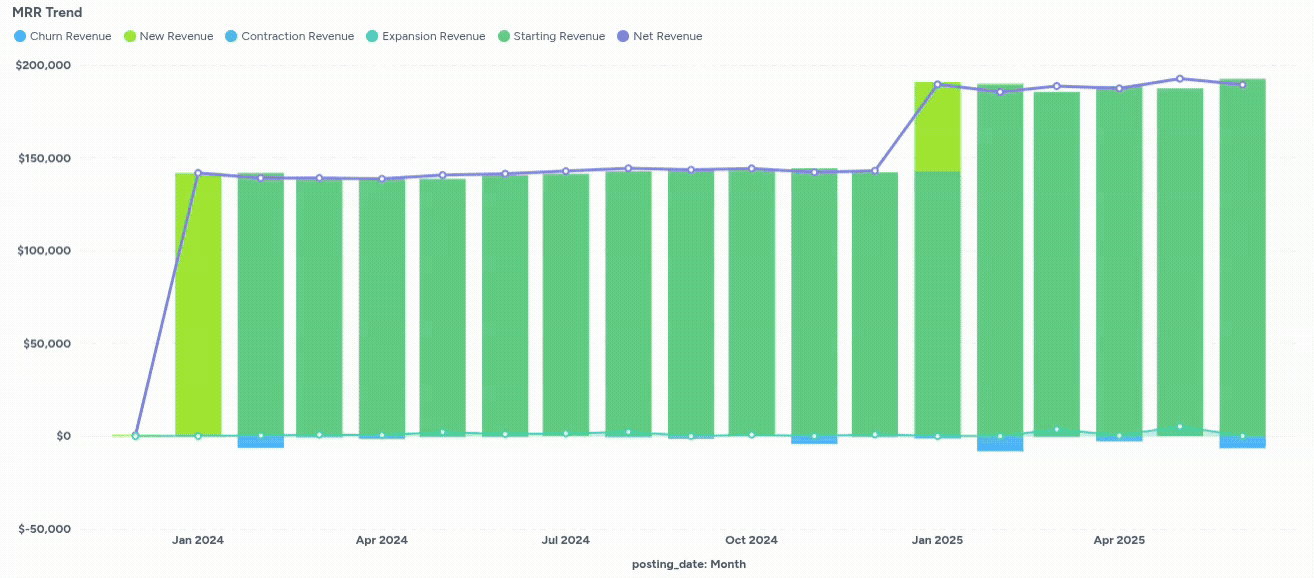
Chart type: Stacked bar chart with trend line overlay
Visual elements:
- Bars: Monthly MRR components (starting, new, expansion, contraction, churn)
- Line: Net MRR trend across periods
- Colors: Consistent color coding for each MRR component
Interpretation guidance:
- Growing bars: Positive overall MRR growth
- Upward trend line: Sustained growth trajectory
- Large expansion segments: Strong upsell performance
- Minimal churn segments: Good retention performance
MRR breakdown table
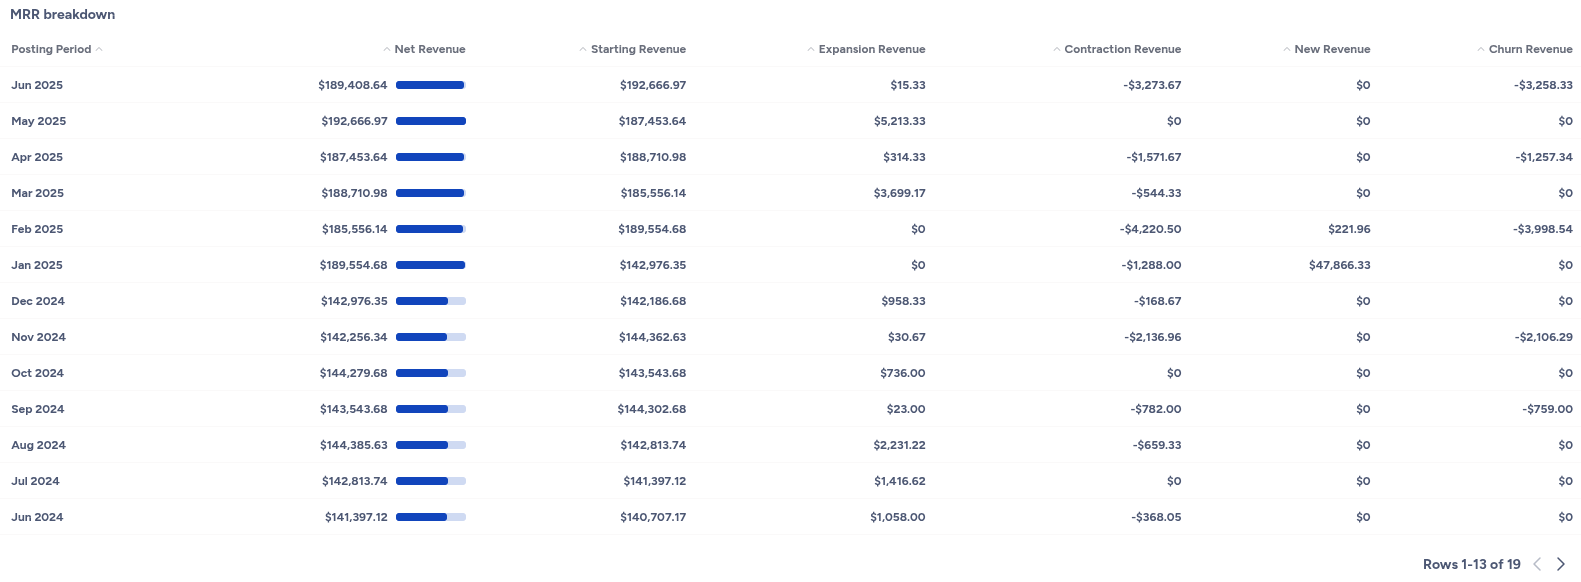
Data structure: Tabular view of chart data with exact values
Use cases:
- Detailed analysis: Precise component values for each month
- Export capabilities: Data for external analysis and reporting
- Historical comparison: Period-over-period variance analysis
Key insights and analysis
Growth velocity analysis
Track month-over-month MRR growth rate:
MRR Growth Rate = (Current Month MRR - Previous Month MRR) ÷ Previous Month MRR × 100Revenue composition health
Monitor the balance of MRR components:
- Healthy: New + Expansion > Contraction + Churn
- At risk: Contraction + Churn approaching or exceeding New + Expansion
- Declining: Net negative MRR movement
Leading indicators
- New MRR trends: Sales performance and market demand
- Expansion MRR patterns: Customer success and product adoption
- Contraction signals: Customer satisfaction and competitive pressure
- Churn indicators: Product-market fit and retention effectiveness
Related metrics
Complementary metrics for complete revenue analysis:
- Net Revenue Retention: MRR retention from existing customers
- Gross Revenue Retention: Pure retention excluding expansion
- MRR by Product: Product-level MRR breakdown
- Net ARR: Annualized recurring revenue view
Best practices
Regular monitoring
- Daily: Track real-time MRR changes during month
- Weekly: Analyze component trends and anomalies
- Monthly: Complete MRR reconciliation and reporting
- Quarterly: Strategic MRR planning and forecasting
Segmentation analysis
- By customer segment: Enterprise vs. SMB MRR patterns
- By product line: Individual product performance
- By acquisition channel: Channel effectiveness measurement
- By geography: Regional performance comparison
Forecasting applications
- Bottom-up: Sum of customer-level MRR projections
- Top-down: Historical growth rate extrapolation
- Cohort-based: New customer MRR lifecycle modeling
This metric is automatically calculated and updated in real-time based on your subscription data and contract changes.
Updated 5 months ago