Payments
Overview
This document provides a comprehensive guide to the Payments tab within the Billings and Collections Dashboard. This tab offers crucial insights into your incoming payments, helping you monitor cash flow, track collection efficiency, and understand payment trends.
Understanding the payments summary
The Payments tab typically starts with a high-level overview of payment activity, providing key aggregated metrics.
- Payments summary: This section provides quick, aggregated numbers for overall payment performance.
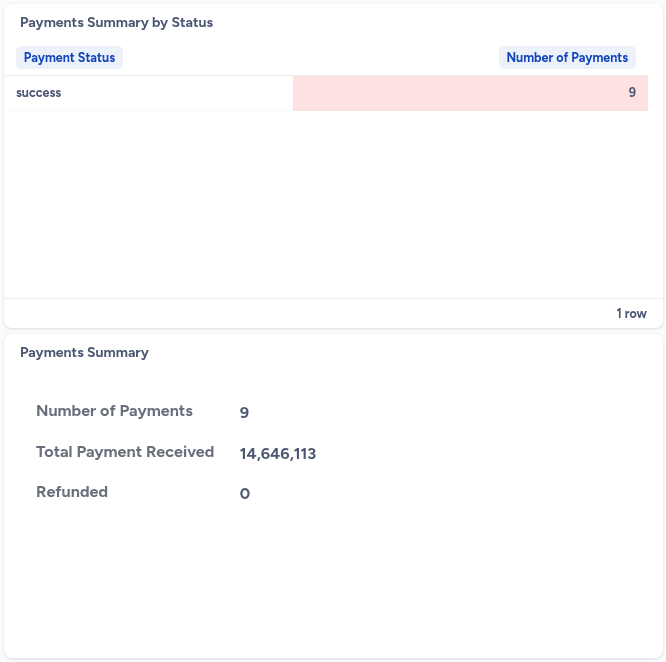
- Number of payments: The total count of individual payments received (e.g., 9).
- Total payment received: The cumulative monetary value of all payments received (e.g., 14,646,113).
- Refunded: The total amount of money that has been refunded (e.g., 0).
Payments summary by status
This report provides a quick overview of payments categorized by their processing status.
-
Understanding the payments summary by status report: This is a simple table showing the count of payments for each status.
- Payment status: The current state of a payment (e.g.,
success). - Number of payments: The count of payments corresponding to that status (e.g., 9 successful payments).
- Payment status: The current state of a payment (e.g.,
-
How this report aids payments analytics:
- Quick status check: Instantly see the breakdown of payment statuses, identifying if there are pending, failed, or successful payments.
- Issue identification: A high number of non-
successpayments could indicate processing issues or customer payment problems.
Payments by customers
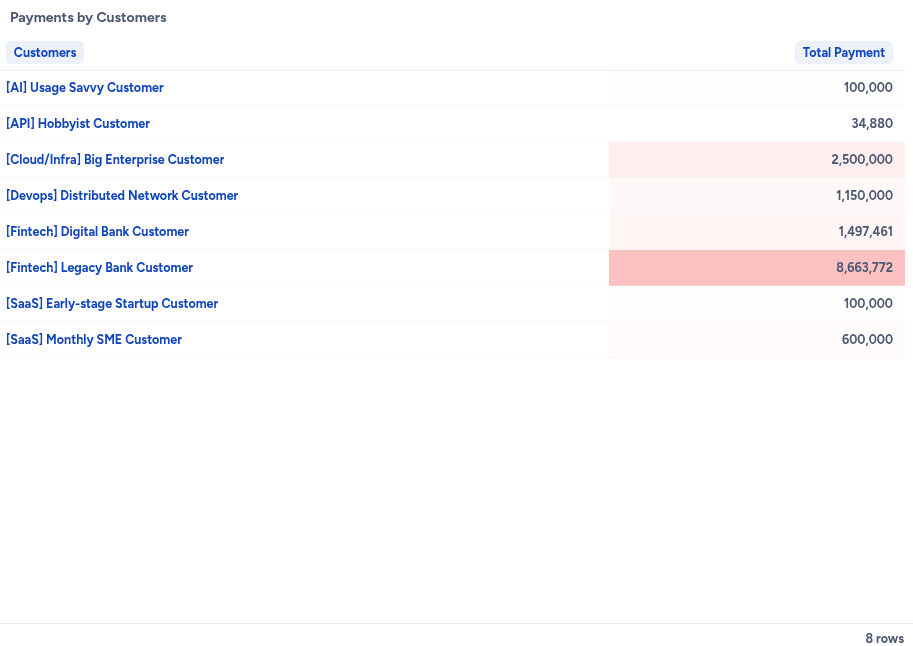
This report breaks down total payments received by individual customers or customer segments.
-
Understanding the payments by customers report: This is a table listing customers and the total payment amounts they have made.
- Customers: Lists individual customer names or predefined customer segments (e.g.,
[All] Usage Savvy Customer,[Fintech] Legacy Bank Customer). - Total payment: The cumulative amount of money received from each specific customer or segment. The red shading, as seen for
[Fintech] Legacy Bank Customer, might indicate a significant payment or a payment that stands out for some reason (e.g., a large single payment or a recent high-value transaction).
- Customers: Lists individual customer names or predefined customer segments (e.g.,
-
How this report aids payments analytics:
- Top payers identification: Easily identify which customers or segments contribute the most to your received payments.
- Customer payment behavior: Understand payment patterns at a granular customer level.
- Revenue concentration: Assess if your payment inflows are concentrated among a few customers, which can inform business risk.
Payments summary (by period)
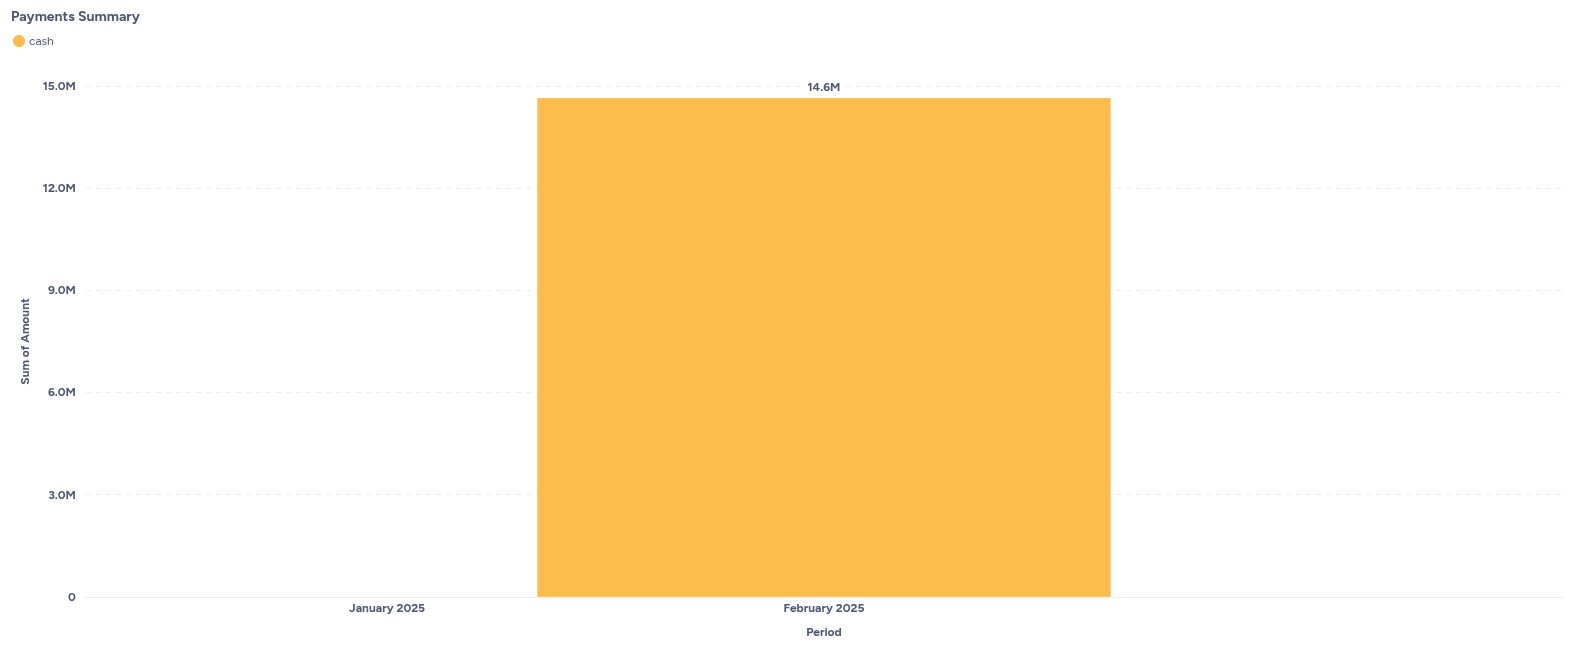
This chart visualizes the total amount of cash received over time.
-
Understanding the payments summary chart: This is a bar chart showing the sum of cash received over different periods.
- X-axis (Period): Represents the timeline, typically by month (e.g.,
January 2025,February 2025). - Y-axis (Sum of Amount): Represents the monetary value of payments received, in millions (e.g.,
3.0M,6.0M, up to15.0M). - Cash (Orange bars): Each bar indicates the total sum of cash payments received during that specific period. For example, in February 2025,
14.6Min cash payments were received.
- X-axis (Period): Represents the timeline, typically by month (e.g.,
-
How this chart aids payments analytics:
- Cash flow trends: Quickly identify periods of high or low cash inflow, helping with cash flow forecasting and management.
- Payment volume over time: Understand the historical volume of payments received.
- Seasonal patterns: Detect any recurring seasonal trends in payment receipts.
Number of payments (by period)
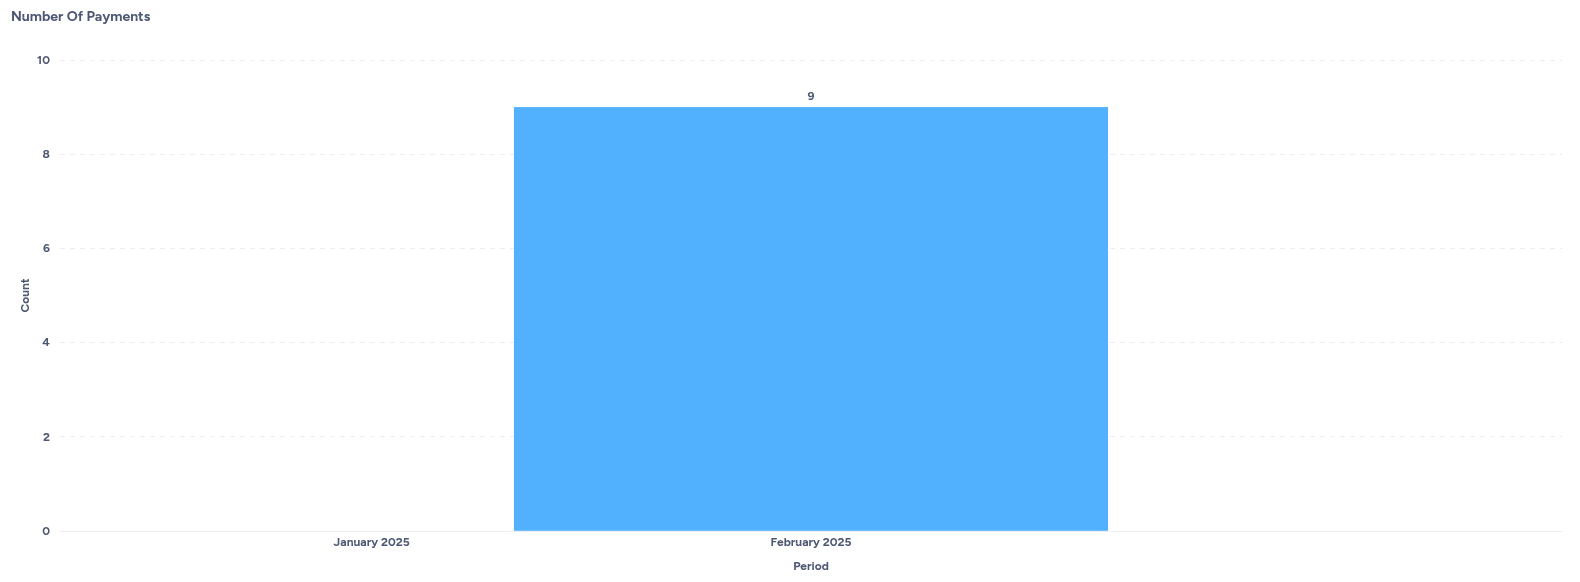
This chart visualizes the count of payments received over time.
-
Understanding the number of payments chart: This is a bar chart showing the total number of payments received over different periods.
- X-axis (Period): Represents the timeline, typically by month (e.g.,
January 2025,February 2025). - Y-axis (Count): Represents the number of payments received, ranging from 0 to 10.
- Blue bars: Each bar indicates the total count of payments received during that specific period. For example, in February 2025, 9 payments were received.
- X-axis (Period): Represents the timeline, typically by month (e.g.,
-
How this chart aids payments analytics:
- Transaction volume: Monitor the volume of individual transactions over time, which can indicate business activity.
- Operational efficiency: A sudden drop or spike in the number of payments might warrant investigation into payment processing or customer behavior.
- Reconciliation: Helps in reconciling payment records by providing a visual count of transactions.
Updated 5 months ago